
by David Severa
I. Introduction
In January 2013, David Cameron, Prime Minister of the United Kingdom, looking ahead to elections in 2015 and trying to manage a Conservative Party internally divided over Britain’s relationship with the European Union, promised to hold a referendum on whether the UK should remain in the EU – a referendum he didn’t want to pass and didn’t think could pass. It was just a sop to Eurosceptics or at most a negotiating ploy to wring some concessions from Europe.
Now, in 2016, the world faces the fallout of that meaningless campaign promise.
Faced with the stark choice of remaining in or leaving the European Union, 52% of voters opted to leave, shocking markets, experts, and the entire British political class. Cameron resigned, the main opposition party is in disarray, and no one on either side of the Channel has any idea what the final settlement will be, or even if the (technically non-binding) referendum will actually lead to exit at all given an establishment that might grasp at any reason to avoid Brexit. Or is this the first step in the crackup of both the UK and EU?
Being unable to see the future, we can at least look at the past and see what led Britain to this crisis, with an eye towards comparison with Donald Trump and American populism. Was the vote to Leave also built on twin pillars of ethnonationalism and long-term decline? I want to look particularly closely at the intersection of discontent and national identity. That is, if people become dissatisfied with the current order, against whom do they turn their ire? Who is Us and who is Them? Because the UK contains within it distinct nations and is nestled within the EU, unlike in the US its populist anger is directed in more directions than just towards national elites. I’ll also look at how stable the Leave coalition is likely to be going forward. Was Brexit caused by just one sort of populism or many sorts coming together to answer a single question?
A. The UK and the EU

The UK within the EU (Source)
The United Kingdom joined the European Economic Community, the EU’s predecessor organization, in 1972, under Conservative Prime Minister Edward Heath after France had previously vetoed British accession. In 1975 the UK held its first referendum on whether or not to stay in Europe. Over two-thirds of voters chose to remain in the EEC, and support was higher in England than anywhere else.
The EEC at the time was a considerably different organization than the EU is today. It was in large part just a customs union, without a common currency, totally open internal borders, or an elected parliament. These functions would slowly accrete with the adoption of various treaties over the coming decades, though Britain managed to opt out of joining both the Eurozone and the Schengen Agreement, which abolished intra-EU border controls.
Both the Eurozone and Schengen have been tremendously weakened the last few years. The fallout from the 2008 financial crisis, mixed with the Euro’s expansion into hugely different economies without the necessary fiscal centralization led to slow growth at best and new great depressions at worst. The recent refugee crisis caused many nations to police their borders again. In short, some of the EU’s signature features haven’t worked as promised. The UK has been relatively insulated from this (though its economy is also not great), but in no part of the UK (even those that voted to remain) do a majority of people have trust in the EU.
Plus most of the EU’s decision-making happens at a level several steps removed from any democratic oversight.
Of course, just because there has been a good deal of mismanagement within the EU doesn’t necessarily mean that the UK is better off outside. After all, Britain will continue to be in Europe geographically and continue to trade mainly with the rest of the EU. So the UK on the outside might find that its biggest trading partner is still in crisis and that trade is much more difficult. Not to mention the costs of uncertainty, the possible exit of much of its financial sector, and so on. All of which is to say that problems in the EU don’t straightforwardly imply that Brexit is a good idea, especially with Britain’s opt outs.
B. Immigration
The UK was able to opt out of Schengen but not the EU’s freedom of movement, which means that any EU citizen is free to live and work in any other EU nation without restrictions (at least after a phase-in for new member states). This did not become a big issue until much poorer post-Communist states started to join the EU in the 2000s. Now free to do so, huge numbers of Eastern Europeans flocked to Britain’s high wages and flexible labor market. 90% of this migration has been to England, concentrated in London and a few cities, leaving much of the rest of Britain relatively untouched:
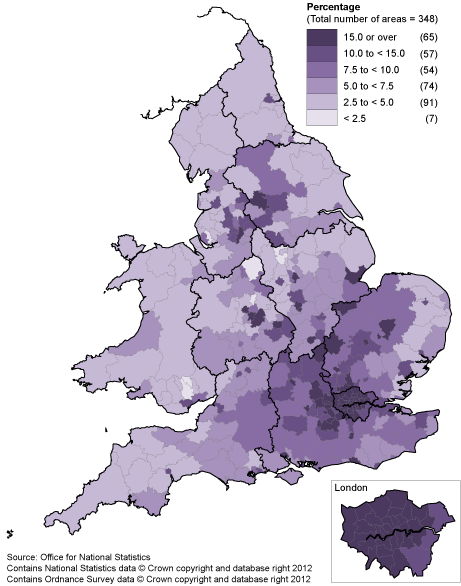
Percentage of population not UK-born (Source)
While not directly related to the EU, but undoubtedly linked in the minds of Britons, there has also been in recent decades a substantial (and substantially non-white) influx of immigrants from outside Europe, most especially from former British colonies like India, Pakistan and those in the Caribbean.
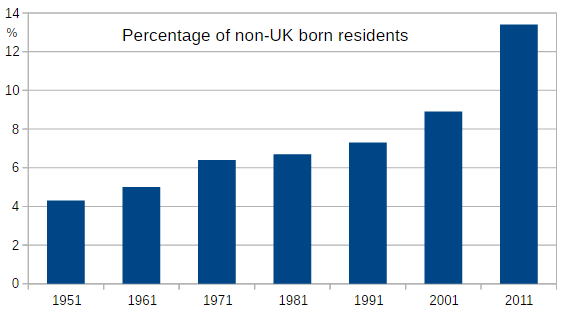
In 2011, 7.5 million people in the UK were born abroad, about 12% of the population. Neither the percentage of migrants from within or outside the EU are too different from other countries in Western Europe, but it is unique in English history: “Britain today receives more immigrants in a single year than it did in the entire period from 1066 to 1950.” (I strongly recommend that article. It presents a strong anti-British immigration case and illustrates where some Leave voters were coming from.)
Percentage of non-UK born residents in England and Wales (Source)
The UK is quite hostile to immigration. Just ahead of the referendum, a majority of Conservative voters (61%) and a plurality of Labour voters (41%) named immigration as their biggest or second biggest concern. In 2013, 56% of Britons favored reducing immigration a lot, and a further 21% favored reducing immigration a little. Concern about EU and non-EU migration is about equal. Over 60% view immigration as “a problem not opportunity”, higher than in other Western countries. (Though note that hostility to immigration long predates this period of mass immigration.)
Of course the long-term impact of immigration is debatable, but when “36.7% of London’s population [is] foreign born (including 24.5% born outside of Europe)” things undoubtedly feel like they have changed hugely, even for those who don’t live in the capital. And although the UK has only taken in a few thousand Syrian refugees, the image of the Calais Jungle, an encampment of migrants in France attempting to enter the UK illegally, is no doubt equally striking.
And it is just as easy to see how worries about immigration are intimately tied up with the EU and its commitment to open borders. Though how much control over migration Britain will retake if it wants to keep access to the EU’s market is very much an open question. As Tyler Cowen says (also a recommended piece):
Cities such as Bradford, while still predominantly white, no longer feel as English (and German!) as they once did. And if you are thinking that voting “Leave” does not at all limit Pakistani immigration, you are truly missing the point; this vote was the one lever the English were given for sending a message to their politicians.
I’ve focused on the reasons why Britons might view all of these changes negatively, but of course you could flip it all around and argue that immigration has enhanced the UK’s economic and cultural vitality.
To summarize, one can make both economic and cultural arguments for and against the EU. The EU has tremendous economic problems, but the UK has been shielded from the worst of it and it isn’t clear that Brexit will improve things. The EU has been one factor increasing migration to the UK, but that might not be a bad thing, and again it isn’t clear how much Brexit would decrease immigration. Now we can start to figure out who in the UK was moved by which arguments and why.
II. Geography
The biggest divides were regional. The United Kingdom is composed of four countries: England, Wales, Scotland, and Northern Ireland. 84% of the population lives in England, 5% in Wales, 8% in Scotland, and 3% in Northern Ireland. While England is very obviously the dominant partner, in recent decades Parliament has devolved some aspects of government to the countries and created Welsh, Scottish, and Northern Irish assemblies. (The UK is still a unitary state – all of these assemblies could be dissolved by Parliament.)
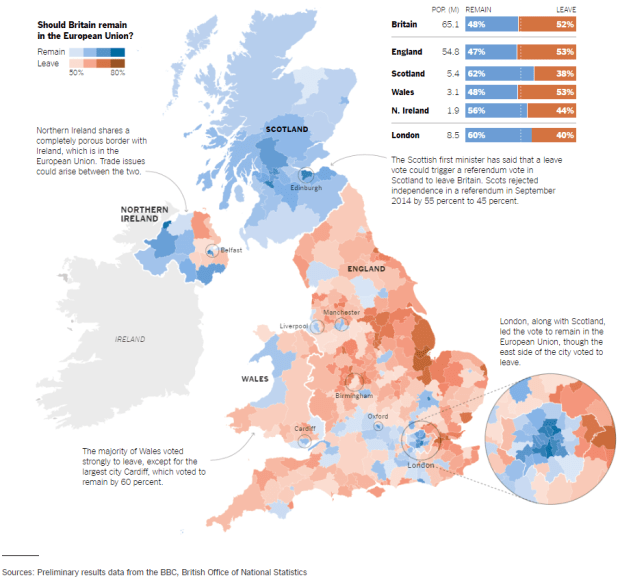
These four countries diverged hugely in the referendum and were divided internally along different lines. Benjamin Wallace-Wells says in the New Yorker:
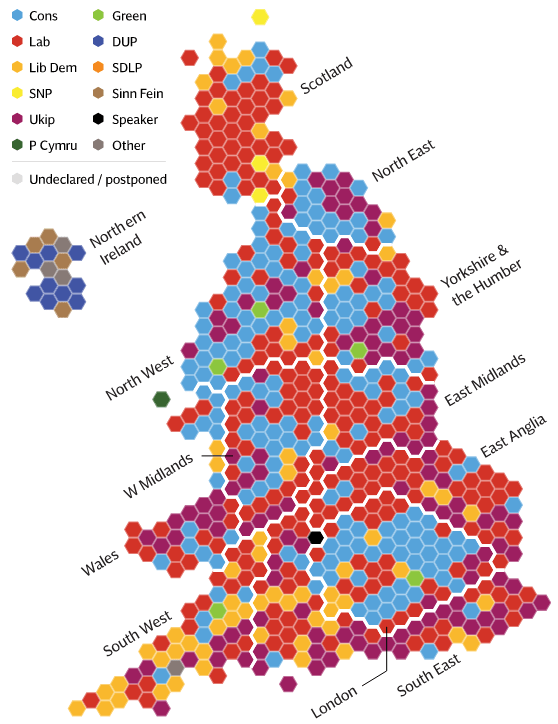
The map showing the results of the United Kingdom’s vote to exit the European Union was stark. There was a bright bulb of support for Remain in and around London, where sixty per cent of voters supported the status quo. Across the rest of England, the vote was to leave. In the northwest and the West Midlands, analysts suggested that the arrival of migrants had antagonized voters; in the northeast, the decline of mining and manufacturing was said to be the cause; in Wales, no one was really sure. Scotland and Northern Ireland, where voters were less moved by nationalist appeals, preferred to remain, and now the question is whether Scottish politicians will renew last year’s effort to sever their own ties with the U.K. But in England, the dividing line seemed clear: there was London, and then there was everywhere else.
 (Source)
I think that we can understand England much more precisely than a simple London/everywhere else dichotomy, but first I want to cover the non-England parts of the UK, as they are smaller and generally more straightforward.
A. Northern Ireland
Northern Ireland is, broadly speaking, divided between Protestants/unionists (who want to remain part of Britain) and Catholics/nationalists (many of whom want to join the Republic of Ireland), who face each other across a gulf widened by centuries of violence (to vastly, vastly oversimplify). Politics in Northern Ireland is structured around an ethnoreligious divide that doesn’t exist anywhere else. The concerns are different and the main parties are different. With its deep cultural ties to, and land border with the Republic of Ireland, an EU member, Northern Irish politics and trade could be vastly disrupted by Brexit, so it’s not surprising voters there supported Remain.
While Northern Ireland did vote to Remain by a considerable margin, there was also a noticeable geographic split. The areas that voted Leave pretty closely match the areas where Protestants form a majority:


(Sources: left, right)
Though note that even in those areas, Leave’s support wasn’t that high, at least relative to parts of England. It’s obvious why nationalists would support Remain, but I’m less sure why unionists would support Leave if there’s a chance that exit could upset the balance in NI against them. But I won’t linger on Northern Ireland, since its population is so small. It’s not unimportant, but not the biggest part of the story.
B. Scotland
Scottish politics have been gradually diverging from the rest of Britain over the last several decades, catalyzed by hostility to Margaret Thatcher’s right wing reforms. First the Conservatives then Labour have been displaced by the Scottish National Party, which instigated the unsuccessful 2014 referendum on Scottish independence. Scotland has become very pro-Europe and the SNP has been open in its desire to imitate Scandinavian welfare states. Scotland voted strongly to Remain and the SNP has threatened to try to either block Brexit or call for another independence referendum should they fail. After the UK voted to leave the EU, 59% of Scots said that they’d now vote for independence.
This pro-EU stance is a reversal from the first referendum on Europe. “Back in 1975 the UK voted to stay in by a clear margin. In the 1970s Scotland was one of the areas that voted most strongly against the Common Market, a total reversal as compared with 2016.” Back then Scotland supported staying in the EEC, but less strongly than England did:

(Source)
I can’t really make out a visible relationship with the results of the 2014 referendum on Scottish independence, but a more detailed analysis might come up with something.
So why have Scottish politics diverged so sharply from those in England? After all, there are regions in England, particularly in the north, that were similarly hostile to Thatcherism, and as we’ll see those areas often supported Leave by great margins. Northern England and Scotland are quite similar in their economic conditions.
One possibility is that it’s due to Scotland not having experienced the same influx of immigrants as England. I’m not sure that’s sophisticated enough. Many of the most pro-Leave parts of England are those that have seen the least immigration. Again, similar conditions but a different outcome.
Perhaps the truth is simple:
And the claim that their vote to stay in the EU — all districts of Scotland voted Remain in the referendum, and 62 per cent of the nation’s voters as a whole voted to stay in the EU — is the product of a broad-minded outlook not seen south of the border also misses a crucial point.
The reality is that the discontent with established politics that erupted in the Leave vote elsewhere in the country has found expression in other ways. As one student of Scottish politics, explaining the UK Independence party’s lack of traction north of the border, put it to me two years ago: “People in Scotland who are disgruntled and suspicious of foreigners [the English] already have a party they can vote for.”
That the difference between Scotland and similar regions of England comes down to a national sensibility – who is Us and who is Them – seems plausible to me. After all, the two nations have only been joined for a few centuries and cultural memories have lingered. The EU is seen as the outside threat in England, but in part as a guarantor against English dominance in Scotland. Or something along those lines. But this is no doubt an oversimplification. Someone who knows Scotland better than me could add much more detail. Still, the central point is that this is a clear instance of culture mattering more than basic economic and demographic conditions. Britons on both sides of the border may be disaffected, but their identities matter a great deal in how that disaffection is understood.
C. Wales
Wales is the closest country to England culturally and their political systems are similar as well. (Wales was conquered in the 1200s and they’ve been governed as one for almost half a millennium.) Other than Plaid Cymru, which advocates Welsh independence, the main parties are the same as in England, including UKIP, which holds 7 seats in the National Assembly for Wales. Wales supported Leave almost as strongly as England.
I think that Wales is perhaps best understood as being similar to the Labour heartlands in the north of England. So much of what I say about northern England applies to Wales as well. Both areas voted Leave to an unexpected degree. Given the lack of success of Plaid Cymru relative to the SNP, perhaps the difference between Wales and in Scotland is that in Wales nationalism is too weak to become a focus of identity in opposition to England. Or perhaps the right circumstances just haven’t yet reinvigorated Welsh nationalism yet. Hence, when people want to direct their anger outwards, they look to Brussels and not London. (To speculate well beyond what the data clearly says.)
D. England
It’s overly simplistic to describe the vote in England as London and a few cities vs. everywhere else. The geographic divide is just the most visible manifestation of a new polarization in English society, one that bears little resemblance to the divisions of past decades but was presaged by the unusual coalition backing the United Kingdom Independence Party. It’s a coalition of the older and the less educated, of those who feel, rightly or wrongly, that the country is moving in a direction hostile to them.
1. Current party system
In England the two largest parties have long been the Conservatives on the right and Labour on the left (with the Liberal Democrats a left wing also-ran third party). Conservatives, under Cameron, have been in power since 2010. While the Labour Party’s leadership pretty uniformly opposed the referendum (though the party’s leader Jeremy Corbyn didn’t vigorously campaign for Remain), Conservatives were more split. Cameron supported Remain, but former London mayor Boris Johnson and a number of other important figures supported Leave.
The parties in England have become geographically polarized. The Economist said in 2013:
Over the years the Conservative Party has been expelled from most of the north of England (and almost all of Scotland). Labour has been virtually driven from the south. Margaret Thatcher once told a newspaper interviewer that economic change has the potential to alter “the heart and the soul” of a people; the double-edged sword of Thatcherism changed the hearts and souls of north and south in strikingly different ways, and with long lasting effects. The differences between them now go beyond economic circumstance—their cultural and political identities are ever more distinct. This represents a daunting but inescapable political challenge.
On ordinary electoral maps the north-south divide is not as plain as it might be. Rural British constituencies are both big and nearly always represented by a Conservative or a Liberal Democrat. Thus swathes of the country will appear blue and yellow come what may. And Northern Ireland is represented by parties not seen elsewhere. If you look just at the mainland, though, and equalise the size of the constituencies, the binary reality becomes obvious (see map). Save for a belt of Tory hills and dales across North Yorkshire and the Lake District, the north is red—as are, barring nationalists, Wales and Scotland. The south is deep blue, strikingly so in the surrounds of London (it gets more Liberal Democrat to the west). Only in London and the Midlands do the parties seem to be in real competition.
…The return of the split reflects the diverging economic experiences of the two halves of the country. Beginning in the 1960s changing industrial fortunes drove a wedge between the manufacturing-oriented north and the services-heavy south. In the 1980s wealth generated by London’s booming financial-services industry turned neighbouring regions a deeper shade of blue. Mrs Thatcher’s monetarist reforms were accompanied by high unemployment, particularly in northern cities. She defeated the National Union of Mineworkers, accelerating the industry’s decline—many former mining towns in Yorkshire and Lancashire struggle to attract new jobs to this day. The privatisation of the steel industry had a similar effect in places like Teesside. In Wales and Scotland Conservatism was widely viewed not just as malign but as a foreign imposition.

So in recent decades England has become divided into three different regions: the north, the South, and London. Even against heavy opposition from outside of England, this has been enough to make the Tories into the generally dominant party in the UK.
However, even as the political system was settling into this post-Thatcher equilibrium, the rise of the United Kingdom Independence Party, an anti-immigration right wing populist party currently led by Nigel Farage, cut across these divisions. Its main aim has been the withdrawal of the UK from the EU. It went from 3.1% support in the 2010 election to 12.6% in 2015, though that only won them a single seat in Parliament. 96% of UKIP voters voted to leave the EU and 25% of Leave voters support UKIP. They aren’t the majority of Leave voters, but they’re the core.
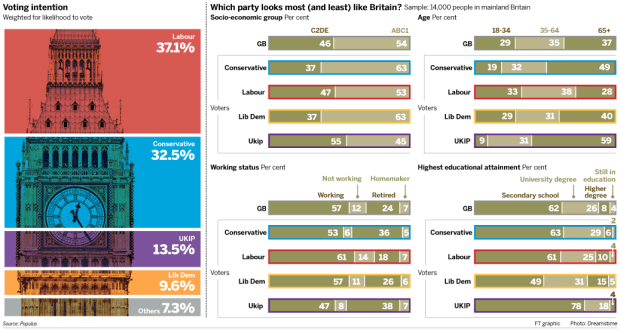
The UKIP draws its support from lower class, less educated, elderly/retired people. Remarkably, 59% of its voters are over 65:
 (Source)
(As it’s measured in Britain, A means upper middle class, B means middle class, C1 means lower middle class, C2 means skilled working class, D means working class, and E means not working [including pensioners and those on welfare].)
A 2014 poll reported by the Financial Times found:
that Nigel Farage’s anti-Brussels and anti-immigration insurgency has reached out to manual, unskilled and unemployed voters, some of whom do not normally vote, many of them living in the Midlands – one of the 2015 election battlegrounds….
Ukip voters are much more likely than supporters of other parties and than Britain overall to have finished education at secondary school level [and not gone further]; the proportion of Ukip voters with higher degrees is half the national average.
On the question of ethnicity, Lib Dem supporters are about the most representative of the country; Labour supporters are nearly twice as likely to be non-white as the national average. Ukip supporters are more than 98 per cent white.
(In 2011 the UK was 87% white.)
Workers in the public sector are less likely to vote UKIP than those in the private sector.
UKIP support varies geographically, and that variation much more closely resembles the Brexit vote than past elections. Check out this map of where UKIP came in second in the 2015 elections, beating one of the two main parties:
 (Source)
Support is scattered across the country (though weaker in the North) but almost absent from London, except for an eastern fringe which also supported Brexit.
The UKIP is a clear and unsurprising predecessor to Brexit – it shows that the referendum was not a fluke but rather the result of a previously politically minor division that has become important.
3. Referendum results
The Guardian describes the divisions within England:
At first blush, London looks like a capital in the midst of a foreign state – an island of Euro-enthusiasm amid a south-east that was mostly resolved to quit. The majorities for remain in some inner-London boroughs werecrushing: fully 75% of the ballot in Camden and 78% in Hackney. But further out, parts of the metropolis began to merge into the countryside beyond. To the south, Sutton went 54% for leave, as did Barking and Dagenham, where 63% wanted out.
Right across the rest of the south-east, East Anglia, Wales and the Midlands, leave was the rule and remain the exception. The exceptions sometimes came in pockets of particular prosperity – Tunbridge Wells, for instance – and then also cities where universities loomed large: Norwich, Bristol and especially Oxford and Cambridge, where remain notched up 70%-plus.
Leave’s overall lead owed much to a strong performance around the coast, and particularly in the east of England….
Further north, the picture was less uniform, several big cities – including Leeds, Manchester and Liverpool – swinging for remain, while old socialist bastions of the second order – Wigan, St Helens, Doncaster and Barnsley – were overwhelmingly for leave.
Like the geographical divide between London and the home counties, the gulf between the northern towns on the one hand and northern cities on the other is a product of sociological schisms. The polls were – once again – materially out in predicting the final result in a close race. But every survey, irrespective of methodology, was quite clear about two cast-iron links: rising age is associated with rising support for leave, while higher social class encourages support for remain.
Or “It was little England, the suburbs, countryside, and decayed industrial towns that wanted to leave.” This is already a more complicated picture than London vs. everywhere else.


On the left, the results of the 2015 election, by constituency. Conservatives are red, Labour is blue, and the SNP is yellow. On the right, the results of the referendum, by voting area, adjusted for population. There are some similarities. Northern Ireland, Scotland, and London all jump out on both maps. But in the rest of England and Wales, things aren’t nearly so identical. Leave clearly won large amounts of support from both Tory territory in the south and Labour regions in the north. And in fact, a substantial minority of Labour voters went along with a majority of Conservatives in backing leave:
A majority of those who backed the Conservative in 2015 voted to leave the EU (58%), as did more than 19 out of 20 UKIP supporters. Nearly two thirds of Labour and SNP voters (63% and 64%), seven in ten Liberal Democrats and three quarters of Greens, voted to remain.
Conservative voters constituted just over three out of every ten remainers, and four in ten leavers. Labour voters made up four in every ten remainers, and two in ten leavers.
UKIP voters accounted for a full quarter of Leave’s support.
So if this political shift is along new lines, what exactly are those lines?
III. Demographics
Now that we’ve gone through the vote by region, we can zoom in on more specific demographic factors. The polling I’ll be citing is mostly about Britain as a whole, but I’ll be using it to talk about England and Wales. Since together they make up close to 90% of the population it shouldn’t be too big of a deal, but remember that Scotland and Northern Ireland are considerably different and included in some of these numbers.
Because the referendum was a single event, rather than, say, a series of primaries as in the US recently, there isn’t as much data out there, but there’s plenty enough to be informative. Also note that one survey I’ll be citing, the Lord Ashcroft Poll occurred the day of the referendum, but wasn’t strictly an exit poll.
A. Disaffection
 (Source)
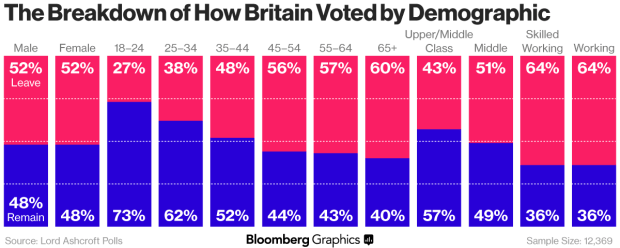
The age gap is immediately apparent and many pundits have jumped on this as evidence that the referendum was a clash between young and old, either the backwards and bitter elderly screwing over the next generation, or the nostalgic but distressed elderly who are the only ones to remember England as she once was voting to stop further decline, depending on your perspective.
Attitudes towards the past seem to factor into the age gap. “Nearly three quarters (73%) of remainers think life in Britain is better today than it was 30 years ago; a majority (58%) of those who voted to leave say it is worse.” 68% of UKIP supporters “would prefer to turn the clock back 20-30 years rather than continue to live in Britain as it is today”. Compare to America, where 66% of Republicans and 75% of Trump voters think that life was better 50 years ago for people like them. And Trump voters skew comparably old.
This nostalgia is paired with pessimism:
A small majority of those who voted to remain think that for most children growing up today, life will be better than it was for their parents; leavers think the opposite by 61% to 39%. Leavers see more threats than opportunities to their standard of living from the way the economy and society are changing, by 71% to 29% – more than twice the margin among remainers.
Unlike Trump in the United States, gender didn’t matter, indicating that Trump’s weaker support among women may be more due to his personality than to the appeal of populism (to the extent that Trump and Brexit draw from the same well of support).
The Guardian looked at voting districts to see which characteristics predicted support for what:
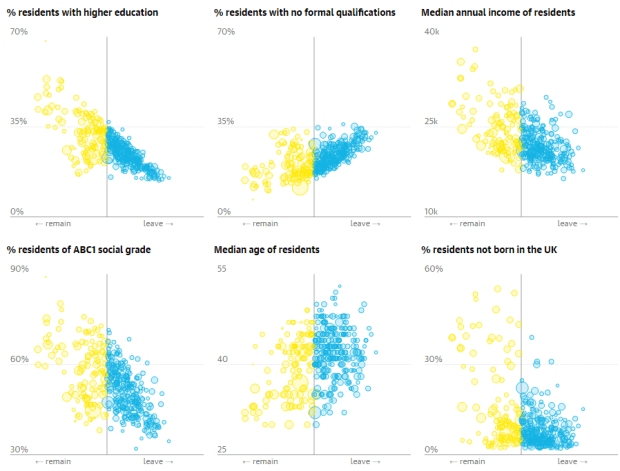
(Source)
Age somewhat matters here, but it’s the extremely strong relationship between education and Leave support that really stands out. And the relationship becomes even stronger if you note that many of those less educated areas that nevertheless voted Remain are Scottish:
 (Source)
If you take out Scotland, you see as tight a correlation as you’re ever likely to see in something like this. Clearly education matters tremendously, or is at least representative of some factor that matters tremendously.
This also implies that London supported Remain for different reasons than Scotland did. There was some separate Scottish factor that made them more likely to support Remain, while London is at the extreme end of traits that predict Remain support within England, like education. London is an English outlier, while Scotland is its own thing. Perhaps this is a sense of nationhood mattering.
You can also see, in both the above poll and above regional breakdown, that class matters. Both lower class voters and lower class regions were more likely to support Leave. The relationship is the same for income and the Financial Times also finds a strong correlation between regions where few people have passports and support for Leave.
Also, “Those who said they paid little or no attention to politics voted to leave the EU by 58% to 42%” while everyone else was evenly divided.
Less education, lower incomes, lower class, less of a connection to the world outside the UK, aging and pessimistic about the future. The world of Leave voters, much like that of Trump voters, is one where the cosmopolitan future doesn’t seem to shine as brightly.
Also as with Trump, how well the economy has done recently is less of a predictor than long term factors:
 (Source)
Unfortunately, there isn’t enough data to really work out the extent to which the people in these worse-off areas who voted to leave the EU were themselves badly off, though they were likely to be lower class. It’s at least possible that, as with Trump support, the Leave vote came in part from people in more destitute regions who were themselves doing relatively well, rather than being on the lowest rungs of society. But that’s just a possibility. In any case, the correlation with social and economic conditions is clear, though those aren’t enough to make Brexit the obvious solution.
B. Immigration
Quite simply, the English want England to stay relatively English, and voting Leave was the instrument they were given. That specific cultural attachment is not for Irish-American me, no, I feel no sentiment, other than perhaps good humor, when someone offers me “a lovely biscuit,” or when a small book shop devotes an entire section to gardening, but yes I do get it at some level. And some parts of the older England I do truly love and I am talking the Beatles and Monty Python and James Bond here, not just the ancients like Trollope or Edmund Spenser.
Much has been made of the supposed paradox that opposition to immigration is highest where the number of immigrants is lowest. Yes, some of that is the racism and xenophobia of less cosmopolitan areas, but it would be a big mistake to dismiss it as such or even to mainly frame it as such. Most of all it is an endowment effect. Those are the regions which best remember — and indeed still live — some earlier notion of what England was like. And they wish to hold on to that, albeit with the possibility of continuing evolution along mostly English lines.
(Source)
That’s a very positive way of framing opposition to immigration, but as this 2015 poll shows, opposition to immigration is indeed widespread. However one side was much more opposed than the other. A supermajority of those planning to vote Leave wanted to cut immigration and a majority of those planning to vote Remain did:
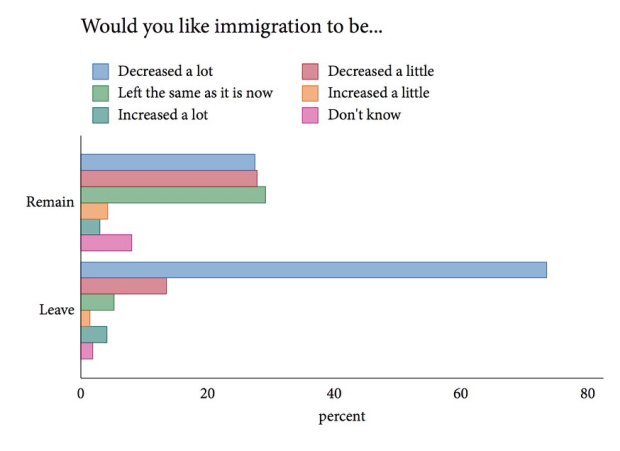 (Source)
And in general, people worried about immigration, globalization, multiculturalism and other modern concerns supported Leave:
 (Source)
But a word of caution on interpreting this graph. As Freddie deBoer notes:
Here is what this graphic says: 81% of those who think multiculturalism is a force for evil voted Leave, to pick one example. Which doesn’t say great things for Leave, I grant you. But here’s what I keep seeing people say on Facebook and Twitter, including a distressing number of professional journalists: that 81% of Leave voters think multiculturalism is a force for evil. That isn’t correct! And it makes a huge difference. If you actually bother to look at the actual data set, as Shashank Joshi has, you’ll see that 14% of Leave voters think multiculturalism is “very much a force for ill.” And that goes for other basic questions of social progress as well.
That is, a core of (lowercase c) conservatives were very strongly pro-Leave, but they didn’t make up the majority of Leave’s coalition.
Areas like London with lots of immigrants were more likely to vote Remain. (This isn’t just because the immigrants themselves voted to stay in the EU.) This is a common thing outside of the UK as well. Areas with immigrants are more friendly to immigration. But there’s a less reported correlation too. The Economist found that:
Where foreign-born populations increased by more than 200% between 2001 and 2014, a Leave vote followed in 94% of cases. The proportion of migrants may be relatively low in Leave strongholds such as Boston, in Lincolnshire (where 15.4% of the population are foreign-born). But it has grown precipitously in a short period of time (by 479%, in Boston’s case).
 (Source)
Areas where immigrants have recently started arriving in larger numbers from typically small bases were more likely to vote Leave. This perhaps supports Tyler Cowen’s argument above that “the regions which best remember — and indeed still live — some earlier notion of what England was like” supported Leave, although there isn’t nearly enough data to rule out other possibilities. For instance, these areas getting new immigrants may be different in character than London or other previous immigration hubs.
C. Race
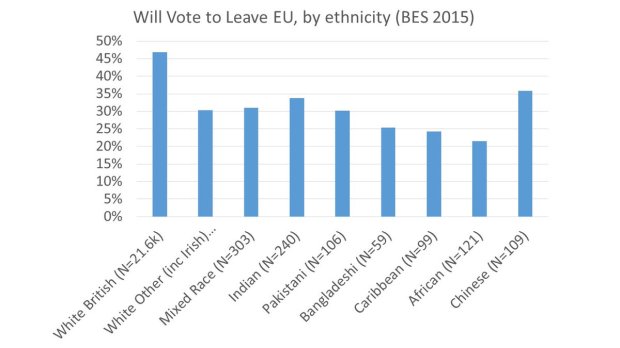 (Source)
This poll from 2015 shows a surprising level of support among non-White British citizens for Leave. (And since Leave gained support, these numbers are probably too low, though it’s possible that support only increased among White Britons.) In general, immigrant groups doing better seem more likely to support leave, which seems the opposite of White Britons. “White Others” are probably less likely because unlike non-white immigrants most of them came from other EU countries.
These results are surprising, but since it’s just one poll with small sample sizes from a year before the actual referendum, I’d be cautious about drawing too many conclusions from it.
D. Identity
Further evidence that one’s sense of nationhood matters:
 (Source)
This is partly due to age. Younger people are more likely to lean towards a British identity than older people. (Though among all age groups, a plurality of over 40% identify as equally English and British.) It’s a shame this question wasn’t broken down so that we could compare, say, “English” elderly and “English” youths. But I’d still guess that this question is getting at something real, a psychological divide of some sort.
(As a side note, I’ll be very curious to see what happens to English nationalism if and when the UK leaves the EU, and/or if Scotland leaves the UK. Against whom will this energy be directed next? Or will it fizzle as the aging core gets replaced by younger voters?)
E. Split rationales
Leave and Remain voters were split in their attitudes:
Nearly half (49%) of leave voters said the biggest single reason for wanting to leave the EU was “the principle that decisions about the UK should be taken in the UK”. One third (33%) said the main reason was that leaving “offered the best chance for the UK to regain control over immigration and its own borders.”…
For remain voters, the single most important reason for their decision was that “the risks of voting to leave the EU looked too great when it came to things like the economy, jobs and prices” (43%). Just over three in ten (31%) reasoned that remaining would mean the UK having “the best of both worlds”, having access to the EU single market without Schengen or the euro.
There is a clear divide between the pro-EU side, citing economic issues, and the anti-EU side, citing issues of sovereignty and culture. Of course, that’s what the debate comes down to, so it’s hardly surprising. The two sides often seemed to be talking past each other, arguing from two incompatible moral worldviews. And apparently the economic imperative has not quite yet come to predominate over cultural imperatives among a large enough share of the population.
Interestingly and perhaps bafflingly, areas more dependent on exports to the European Union were more likely to vote Leave:
 (Source)
While it may be one thing for an investment banker to understand that they ‘benefit from the EU’ in regulatory terms, it is quite another to encourage poor and culturally marginalised people to feel grateful towards the elites that sustain them through handouts, month by month. Resentment develops not in spite of this generosity, but arguably because of it. This isn’t to discredit what the EU does in terms of redistribution, but pointing to handouts is a psychologically and politically naïve basis on which to justify remaining in the EU….
This taps into a much broader cultural and political malaise, that also appears to be driving the rise of Donald Trump in the US. Amongst people who have utterly given up on the future, political movements don’t need to promise any desirable and realistic change. If anything, they are more comforting and trustworthy if predicated on the notion that the future is beyond rescue, for that chimes more closely with people’s private experiences.
Again, the thought process of the typical Leave voter does not seem to have been one that can be easily reduced to costs and benefits. Deeper cultural and national sentiments were unavoidably at play.
IV. Conclusion
Discussing the Leave-backing regions in England, Will Davies argues that “The geography reflects the economic crisis of the 1970s, not the 2010s”:
It became clear early on in the night that Leave had extraordinary levels of support in the North East, taking 70% of the votes in Hartlepool and 61% in Sunderland. It subsequently emerged that Wales had voted for Leave overall, especially strongly in the South around areas such as Newport. It is easy to focus on the recent history of Tory-led austerity when analysing this, as if anger towards elites and immigrants was simply an effect of public spending cuts of the past 6 years or (more structurally) the collapse of Britain’s pre-2007 debt-driven model of growth.
But consider the longer history of these regions as well. They are well-recognised as Labour’s historic heartlands, sitting on coalfields and/or around ship-building cities. Indeed, outside of London and Scotland, they were amongst the only blobs of Labour red on the 2015 electoral map. There is no reason to think that they would not stay red if an election were held in the autumn. But in the language of Marxist geographers, they have had no successful ‘spatial fix’ since the stagflation crisis of the 1970s. Thatcherism gutted them with pit-closures and monetarism, but generated no private sector jobs to fill the space. The entrepreneurial investment that neoliberals always believe is just around the corner never materialised.
Labour’s solution was to spread wealth in their direction using fiscal policy: public sector back-office jobs were strategically relocated to South Wales and the North East to alleviate deindustrialisation, while tax credits made low productivity service work more socially viable. This effectively created a shadow welfare state that was never publicly spoken of, and co-existed with a political culture which heaped scorn on dependency. Peter Mandelson’s infamous comment, that the Labour heartlands could be depended on to vote Labour no matter what, “because they’ve got nowhere else to go” spoke of a dominant attitude. In Nancy Fraser’s terms, New Labour offered ‘redistribution’ but no ‘recognition’.
This cultural contradiction wasn’t sustainable and nor was the geographic one. Not only was the ‘spatial fix’ a relatively short-term one, seeing as it depended on rising tax receipts from the South East and a centre left government willing to spread money quite lavishly (albeit, discretely), it also failed to deliver what many Brexit-voters perhaps crave the most: the dignity of being self-sufficient, not necessarily in a neoliberal sense, but certainly in a communal, familial and fraternal sense.
I’ve included Davies’s suggestion as to the underlying reason for this political shift, but you don’t have to agree with it to agree that a sense of alienation was at the heart of much of the Leave vote. Much as in the US, economic concerns and ethnonationalist anxiety were combined:
As I moved south, I thought that the economic picture might change, but in Rugby, Bedford, Luton the high streets all had the by now familiar composition: betting shops, fast-food outlets, tattoo parlours. And the answer to the question “in” or “out” never changed either. “We’ve been left behind,” a white, middle-aged man told me at a bus stop as I rested in Hemel Hempstead. “Those politicians don’t care about us. Immigration has ruined this country.”
Something like this attitude predominated in both England and Wales in the referendum. Despite Scotland turning its anxieties against the UK rather than the EU, despite the opposition of young, cosmopolitan England, the vote was clear.
To summarize, much of the UK feels anxious about the future, whether for cultural reasons or because of long-term economic decline. While those who are doing well (the young, the educated, the cosmopolitan) aren’t so inclined to change things, those who feel themselves to be on the wrong side of the future have reacted in different ways based on nationality, despite facing similar problems. In Scotland, voters turned against the UK’s fiscal conservatism and towards social democracy and Europeanism. In culturally more similar England and Wales, voters turned against the EU. Parliament was a less tempting target because they, being so predominant numerically, controlled it.
Still, the vote for Leave was thus not just one thing. Much of it was nativist, but that wasn’t enough to get to 50%. Many different sentiments, generally tied to similar sorts of anxieties, were all funneled into a single yes-or-no vote. Leave was a one-time coalition, rather than an ongoing concern. This has important implications going forward:
Thus, the Leave side represents something of an unholy coalition. The referendum was sparked by demands from segments of the Conservative political elite for relief from the regulations of the E.U. in the name of national sovereignty. But focus groups organized for the vote revealed that most ordinary people had no idea what sovereignty actually means.
Instead, the issue dominating the vote was immigration, and the margin of victory for Leave came from traditional Labour voters worried that an influx of workers from Europe was depressing their wages or taking their jobs. That influx is real. While Britain had 66,000 immigrants from the E.U. in 2003, 270,000 came last year. However, it is notable that support for Brexit was strongest in areas with little immigration and weakest in London, a cosmopolitan city where nearly half the residents are foreign-born. To borrow an older terminology, this referendum pitted Britain’s most vibrant “boroughs” against its “shires.”
Of course, one of the many questions facing the country is how that contradictory coalition — one side of which wants deregulation, while the other wants jobs and better public services — will find representation in the British Parliament. British opinion is evidently polarized, not only over E.U. membership but about the economic way forward; and its current party system is not well-configured to represent these divisions in the electorate.
On one side, a “little England” camp comprising a large segment of the Conservative party and the United Kingdom Independence Party (UKIP) is hostile to immigration and interested in deregulation. On the other side of the spectrum are the activists who elected Jeremy Corbyn leader of the Labour Party, skeptical about transnational arrangements and determined to rein in the excesses of British capitalism. Meanwhile, many of those who supported the Remain campaign are centrists, currently spread over segments of the Conservative, Labour and Liberal Democratic parties. As the poet has it, this is surely a context in which “the center cannot hold.”
While one could certainly imagine Brexit’s coalition reforming to fight on specific issues – think about the struggles in the US against free trade agreements waged from both left and right against technocratic centrism – that doesn’t show that a longer lasting populist alliance would be workable. But assuming this current populist movement does have legs (which is frankly debatable given the very limited appeal right wing populism at least has shown to the young), then other possibilities seem likelier. In particular, the continuation of the intraparty struggles we’ve seen in both the left and right in both the US and UK. The dynamics of politics in the future would depend greatly on who triumphed on each side or whether one or both sides were unable to escape a long period of internal fighting.
The supporters of Brexit won (probably), but the future is still uncertain.


 (
( (
(
 (
( (
( (
(


 (
( (
( (
( (
( (
(

 (
(


