
[Part I; Part II; Part III; Part IV; Part V; Part VI; Part VII; Part VIII; Single page]
by David Severa
Welcome to the first Overview at Veracities! This will be a regular feature where we summarize the current state of research on various topics we think are interesting. We’ll take as broad a view as possible to give you an overall picture of what is and isn’t yet understood. First up: the demographics of Trump support.
Something altogether unprecedented is happening in American politics, unless it isn’t. A new bloc of voters have been awakened from their quiescent slumbers, unless they haven’t. This bloc heralds the rise of a reinvigorated Republican Party, unless it threatens to tear the party apart. Much of the American public is surrendering to an authoritarian or even Fascist impulse, unless they aren’t. Trump voters are either certainly X or certainly not-X.
Many (mostly unflattering) comparisons have been made to Donald Trump since his official entry into American politics last year, from Andrew Jackson to George Wallace to modern European right-wing populists and even to Hitler. So while it isn’t clear that Trump is wholly unique, he is clearly an anomaly deserving explanation.
More specifically, I want to look closely at who is voting for Trump. What are their demographics? What are their beliefs? Their motivations? How do they see America and the world? I’ll begin by looking at basic demographic factors and then move on to broader social factors. Then I’ll talk about the ideas and ideologies that have been attributed to Trump voters and how well supported these attributions are. I’m not going to be able to disentangle the entire web of causation and correlation. I won’t be saying “23% of Trump’s support is due to a loss of manufacturing jobs”. Instead, I hope to illustrate a world and a worldview. (Spoiler: Trump supporters are right wing populists not just motivated by economic concerns.)
I’ll mainly talk about his support during the primaries, partly because that’s where the data is and partly because as nominee he’s likely to win even those Republicans who aren’t natural Trump supporters, muddying the difference between Trumpists and other Republicans. I’m not trying to explain the demographics of the Republican Party itself, so this article will focus mainly on how Trump support differs from that of other candidates, rather than from the nation as a whole. In general, he is somewhat popular among Republican groups and very unpopular among everyone else, but there are of course differences in degree.
Over time, Trump’s support among Republicans has grown from around 25% in late 2015 to around 40% in late April, which means that Trump’s coalition has broadened. The research and articles cited here come from different points in time, so their numbers may not always be directly comparable. But for creating an overall impression, hopefully that won’t matter too much. I have, however, mostly limited myself to sources from after the first primaries and before Trump became the presumptive nominee after winning Indiana.
Trump voters within the Republican Party
To date, Trump has received 10,999,775 votes, 40.65% of the total. While the absolute number is comparable to those of past nominees, because turnout has been higher this year, his share is considerably lower, and he is on track to become the first Republican nominee in decades who hasn’t won a majority of popular votes. Who, then, makes up his victorious plurality?
This Wall Street Journal infographic is an excellent introduction. It breaks down support for Trump along a number of dimensions in comparison to “Establishment Voters” supporting Bush and Rubio and “Social Conservative Voters” supporting Cruz and Carson. (How quickly time flies in campaign season!) Of the three groups, Trump supporters are least likely to have college degrees, least likely to have household incomes of over $75,000, and least likely to regularly attend church.
Only 31% call themselves “very conservative” versus 51% of social conservatives and 20% of establishment supporters. Nevertheless, they oppose same-sex marriage and support gun rights, though they are the least pro-life of the three groups.
They are the group most skeptical of the rest of the world. 81% of Trump voters say that immigration hurts America more than it helps, versus 60% of Social Conservative Voters and 45% of Establishment Voters. Trump voters are also most skeptical of free trade and most inclined to focus on “problems at home rather than overseas”.
That should give an overall picture. Poorer, alienated from institutions, focused on America. But note that he draws support from both sides of each of these divides. That will be a recurring theme: while one can say that Trump voters are more or less concentrated in a given group, his support is quite broad, at least among Republicans. The typical Trump voter is not a stereotypical Trump voter. It’s at most useful to talk about tendencies rather than make categorical statements.
Live vs. online polling
Trump does “about five percentage points” better in online polls than when talking to a live interviewer, possibly due to social desirability bias: “people are afraid to tell another human being that they support the Republican because, even though they like him, they know about his controversial statements and do not want to be judged negatively.” The gap was larger, closer to 10 points, for voters with bachelor’s or graduate degrees, and for more informed voters.
Gender

(Source)
Trump is often accused of sexism and he has a history of controversial statements towards women and it’s reflected in the polls. He’s very unpopular overall, but there is a clear gender gap: 58% of men and 70% of women view him unfavorably. “The gap between his favorable and unfavorable rating among men averaged 22 percentage points in March 1-28 interviewing, compared with a 47-point gap among women.” Also, while his numbers have been declining for months, the decline has been roughly the same among both men and women; he simply started off doing better among men.
According to a national Quinnipiac University survey in March, only 29 percent of women have a favorable view of Cruz, while 46 percent have an unfavorable view. A CNN-ORC poll the same month found that 28 percent of the women surveyed overall had a favorable view overall of Cruz, and 58 percent had an unfavorable view.
Still, in both surveys, Trump’s numbers were considerably worse: His unfavorability rating hitting 67 percent in the Quinnipiac poll, and 74 percent in the CNN survey.
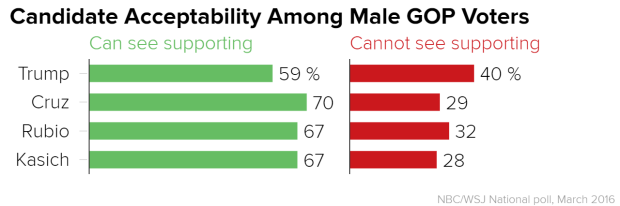
Let’s focus on the GOP. Among Republicans, Trump is the only candidate with a significant difference in how many men and women wouldn’t consider supporting him:

 (Source)
Of course this is just for the primary; most of these people will wind up voting in the general for whoever the nominee is, regardless of what they say now. And in any case, according to exit polls, Trump still won a plurality of women voters in most states, though consistently smaller than his pluralities among men:
 (Data from here; graph created by me; not all states exit polled)
(Most primaries were pretty evenly split between male and female voters. Except for New York and Connecticut, men never made up more than 53% of the electorate.)
Alabama produced an anomalous gap of 16 points, but in general the difference in support hovered between 5 and 10%. Ted Cruz, on the other hand, polled more evenly between men and women, though generally behind Trump among both.
Overall, Trump’s poor standing with women has cost him some votes in the primaries, but will be a larger issue in the general election.
Age
In December, a Wall Street Journal/NBC News poll found that “Among those aged 18 through 34, just 19% have positive feelings about Mr. Trump. Among those aged 50 through 64, the level rises to 35%. It’s 32% among those aged 65 and over.”
Among Republicans specifically there is also an age gap, though it’s not huge:
 (Source)
Exit polls have found a similar difference:

(Data from here; graph created by me; not all states exit polled)
The youngest voters were generally least supportive of Trump, but otherwise things are close. In no race were 18-29-year-olds most likely to vote for Trump. In only one race, Arkansas, were those aged 30-44 most likely, excluding ties. The elderly and most especially the middle-aged are clearly likeliest to support him. For the most part the gap between least- and most-likely groups is under 15 points, and often 10.
However, these groups did not make up equal shares of the electorate. Roughly 10+% of the electorate was 18-29, 20% was 30-44, 40+% was 45-64, and 20+% was 65+, with variation by state. Therefore, a large plurality of Trump voters were middle aged:

(Data from here; chart created by me; not all states exit polled; percentages may be slightly off for states where the 18-29 demographic was too small to be counted)
Again though, we can only speak of tendencies: Trump draws support from many groups of Republicans.
Race
Trump is wildly unpopular with non-white voters overall. His net favorability with Hispanics is -65%, compared to other Republicans, who roughly break even (and to +33% for Clinton). One “tracking poll found that Trump was viewed unfavorably by 86% of black voters and 75% of Latinos.” An “NBC/Wall Street Journal survey found two-thirds of voters overall saying that they could not see themselves voting for Trump. Among nonwhite voters, the figure was 84%.”
But what about among non-white Republicans? Have they helped or hurt Trump?
It’s important to understand that a huge majority of Republican primary voters are non-Hispanic whites. In 2012, self-identified Republicans were 89% non-Hispanic white, 2% non-Hispanic black, 6% Hispanic, and 1% Asian. Trump hasn’t changed that. Of the 26 states that were exit polled, in only 5 states were non-Hispanic whites less than 90% of the Republican electorate: Nevada (85%), Georgia (88%), Texas (82%), Virginia (86%), and Florida (78%). Along with North Carolina and Ohio, these are the only states where non-Hispanic white Republicans have been analyzed separately in these exit polls.
Trump won the mainly Latino minority vote in Nevada with 42%. In every other state with available data, he lost Hispanic and non-White voters. Given that turnout is up overall while the minority share of the vote hasn’t changed much, there have obviously been more minority voters in the primaries to date. However, these voters have mainly opposed Trump. He is losing both non-white Republicans and non-whites overall.
New voters?
Republican turnout has been dramatically higher than in 2012 – some 60% – this primary season. (Although note that this doesn’t necessarily translate to better turnout in the general election.) One reason for this is simply that the contest has been seriously contested for longer than in 2012. (Democratic turnout is down 19% from 2008, though it’s just a two person race and Sanders has never had Obama’s odds of defeating Clinton.) Who are these new voters? New Republicans? Loosely attached Republicans?
While turnout has indeed been high this cycle, it’s not clear that Trump is really expanding the party:
Republicans are seeing their voter registration rolls grow instead of shrink for the first time in years at this stage in the federal election cycle, but not by much. “The Republican Party share of the voter registration in the country is up slightly, as compared to the last tally, which was November 2014,” said Richard Winger, editor of Ballot Access News. “It’s the first time the Republicans have gone up instead of down since 2004.”
In February 2016, there were about 30.5 million registered Republicans nationally, Ballot Access News reported. That’s compared to 30.9 million in October 2014, 31.3 million in October 2012, 30.9 million in October 2008, and 29.0 million in October 2004.
Most partisans don’t vote in primaries, so increased turnout can easily come mostly from newly energized Republicans. Trump has undoubtedly drawn less attached Republicans to come to the polls, but remember that Trump has mostly only won pluralities rather than majorities, so some amount of increased turnout is due to the anti-Trump vote.
Unfortunately, most exit polls haven’t asked people if it’s their first time voting in primaries, so we don’t have a full picture of who Trump is bringing in. According to the Los Angeles Times:
In Iowa’s caucuses this year, Trump clearly did well with first-time participants. The share of voters taking part in the state’s caucuses for the first time rose from 38% in the 2012 exit poll to 45% in 2016, and Trump won the first-timers handily. In New Hampshire, by contrast, the 15% of voters casting a GOP primary ballot for the first time this year was only marginally higher than the 12% four years ago, and Trump’s share of their votes, 38%, was only slightly better than the 35% he got among repeat voters.
Also:
Polls show that moderate Republicans — not Democrats and independents, as Trump often claims — have also helped boost turnout numbers in 2016.
According to the analysis by Public Opinion Strategies, which included the most recent round of voting on Tuesday in Utah, Arizona, and Idaho, 42 percent of Republican primary voters so far this year identify themselves as “somewhat conservative,” up from 33 percent at this stage in the 2012 race.
As Trump supporters are less likely to self-describe as strongly conservative than other Republicans, this change is plausibly due to Trump bringing in new voters to the primaries.
Democratic defectors? Independents?
Anecdotes abound about voters torn between Trump and Sanders, and pundits have wondered if Trump, not a doctrinaire conservative, might attract Democrats. One poll in January found that 20% of Democrats would vote for him – but also that 14% of Republicans would vote for Clinton! However, this poll is most likely an anomaly:
According to the Reuters tracking poll, which follows responses over time to measure changes in support or opinion, more than 73 percent of whites who voted for President Obama in the last presidential election hold a negative opinion of Trump, versus 27 percent who hold a favorable opinion. It’s difficult to do a direct comparison, but this is in line with Mitt Romney’s standing among white self-identified liberals in the September before the 2012 election. Better is an apples-to-apples comparison between Trump and his nearest rival, Ted Cruz. Whites who voted for Obama like Cruz—a doctrinaire conservative ideologue—about as much as they like Trump, 28 percent favorable to 72 percent unfavorable.
A March Washington Post poll found that in a hypothetical matchup with Trump, Hillary Clinton wins Democrats 86 to 9 percent. That means, right now, that Trump does indeed gain a few more Democratic defections than Romney did. The problem is that Trump is only winning Republicans 75 to 14 percent. In other words, more Republicans are planning to vote for Hillary than Democrats are planning to vote for Trump, which helps explain why Clinton is leading in almost all the head-to-head polls.
(Trump has gained Republican support since clinching the nomination.) While this election is itself anomalous and Trump is relatively unpredictable, the weight of evidence to date suggests that Trump lacks appeal to both Democrats and independents. And in fact, votes to date back this up: “The share of the GOP primary electorate that identified as Democrat stayed steady at 5 percent, while the percentage of independents grew one point, from 26 to 27 percent.”
 (Source)
Again, increased turnout means that more Democrats and independents must have voted Republican, but the numbers are small overall. In no way could they be a major part of Trump’s base. His main support comes from Republicans, both party stalwarts and especially more weakly attached voters, not from drawing in non-Republicans.
Summary
Like for the GOP as a whole, support for Trump is overwhelmingly white. Relative to other Republicans, Trump voters are older and more male, but Trump often won among women and the young regardless. He may be drawing in less attached Republicans, but independents and Democrats haven’t much helped him.
Next: Where are Trump voters from? What are their ethnic backgrounds?

Typo:
“It’s first important to understand how few Republican primary voters are non-Hispanic whites. In 2012, self-identified Republicans were 89% non-Hispanic white..”
Should be either “how many are non-Hispanic” or “how few are Hispanic”.
LikeLike
Fixed. Thanks.
LikeLike
Interesting data and analysis!
Presentation-wise, though, you really shouldn’t use line graphs for categorical data like those support-by-age-by-state or support-by-gender-by-state graphs (e.g. https://veracitiesdotonline.files.wordpress.com/2016/05/capture19.png?w=620)
The interpolated lines between the data points are completely meaningless. The x-axis in these charts represents discrete categories, not a trend over time (or any other varying quantity), so you should use a chart which doesn’t suggest a non-existent relationship between the data points along that axis. These really ought to be bar charts. Or maybe just colour/shape-coded data points.
LikeLike
Thanks for writing! But those states are in fact listed in the order they had their primaries (Iowa first, New Hampshire second, etc.). Still, I was originally just going to use data points with no lines connecting them, since the movement up or down over time mostly had more to do with the state’s geographical location than with its place in the primary calendar, but I found that too hard to read, so I switched to the way it is now.
LikeLike